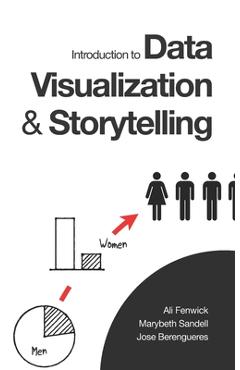
Introduction to Data Visualization & Storytelling: A Guide For The Data Scientist - Ali Fenwick

Detalii Introduction to Data Visualization &
libris.ro
69.68 Lei
77.42 Lei
Business & Economics
Ali Fenwick
Introduction to Data Visualization & - Disponibil la libris.ro
Pe YEO găsești Introduction to Data Visualization & de la Ali Fenwick, în categoria Business & Economics.
Indiferent de nevoile tale, Introduction to Data Visualization & Storytelling: A Guide For The Data Scientist - Ali Fenwick din categoria Business & Economics îți poate aduce un echilibru perfect între calitate și preț, cu avantaje practice și moderne.
Preț: 69.68 Lei
Caracteristicile produsului Introduction to Data Visualization &
- Brand: Ali Fenwick
- Categoria: Business & Economics
- Magazin: libris.ro
- Ultima actualizare: 28-10-2025 01:22:05
Comandă Introduction to Data Visualization & Online, Simplu și Rapid
Prin intermediul platformei YEO, poți comanda Introduction to Data Visualization & de la libris.ro rapid și în siguranță. Bucură-te de o experiență de cumpărături online optimizată și descoperă cele mai bune oferte actualizate constant.
Descriere magazin:
Used in universities and biz schools in Finland, Barcelona, USA, Korea, Canada and the Middle East; and in executive trainings of companies like Halliburton TX, Agilent and PropertyFinder, this book will help you to transform data into not just information, but valuable knowledge. *** In this book, you will learn by example how to visualize the fascinating topics of gender equality, inclusion, solar energy and bias. You will also learn, What is the role of a narrative in a graphic; The foundations of visual narratives and what is the relationship between data, information and knowledge. The authors (a Kaggle master, a Bloomberg ex bureau chief and a psychology professor) bring together concepts of Data Science, Design Thinking and Strategy to take the reader on a journey where the destination is nothing less than great visual storytelling. You can be an MBA candidate, an instructor, a strategy consultant or an entrepreneur, this book explains the visual fundamentals for building graphics that convince decisivelyDesigned as a series of Socratic exercises, this book is for you if you work with Excel, SPSS, or Tableau; no data skills or special math skills are required. What will you learn? (learning outcomes) Identify the role of a narrative in a graphic. Transform data into information. Synthesize knowledge from data. Apply visual thinking tools to the decision-making process. Select visual communication techniques to persuade. Detect biases and lies in charts. Praise from the readers look at this tremendous contribution - Juan Riquelme D az, Editor del Grupo Valpara so en SoyChile I was going through the book and it looks great - Mauricio Zanotti - Director ONG La ruta SolarHere in Argentina the community in data science is really growing, and I love visualizations and find the way to tell the story. - Agustin Blacker Along with greeting and thanking you for such a good contribution delivered through the book I am reading (now in its translated version). - Rosa Velasques An eye opener - Benjamin Jon, Wales.A holistic approach to how to create knowledge with classic rhetoric. - Birgitta Edberg About the authors Marybeth Sandell is a Swedish-American journalist and has been, among others, bureau chief of the Bloomberg London office. He has worked in Stockholm, Zurich and New York; and has taught at the University of North Carolina. She has a Masters in Communication and Technology from UNC Cha

Produse asemănătoare
Produse marca Ali Fenwick

Introduction to Data Visualization & Storytelling: A Guide For The Data Scientist - Ali Fenwick
![]() libris.ro
libris.ro
Actualizat in 28/10/2025
69.68 Lei

Red Flags, Green Flags: Modern Psychology for Everyday Drama - Ali Fenwick
![]() libris.ro
libris.ro
Actualizat in 05/06/2025
189.67 Lei

Red Flags, Green Flags: Modern Psychology for Everyday Drama - Ali Fenwick
![]() libris.ro
libris.ro
Actualizat in 08/04/2025
206.41 Lei