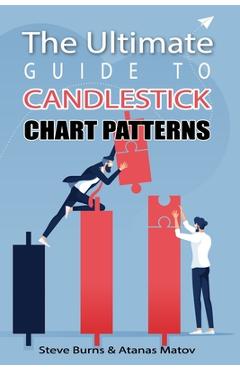
The Ultimate Guide to Candlestick Chart Patterns - Atanas Matov
Detalii The Ultimate Guide to Candlestick
libris.ro
111.53 Lei
123.92 Lei
Business & Economics
Atanas Matov
The Ultimate Guide to Candlestick - Disponibil la libris.ro
Pe YEO găsești The Ultimate Guide to Candlestick de la Atanas Matov, în categoria Business & Economics.
Indiferent de nevoile tale, The Ultimate Guide to Candlestick Chart Patterns - Atanas Matov din categoria Business & Economics îți poate aduce un echilibru perfect între calitate și preț, cu avantaje practice și moderne.
Preț: 111.53 Lei
Caracteristicile produsului The Ultimate Guide to Candlestick
- Brand: Atanas Matov
- Categoria: Business & Economics
- Magazin: libris.ro
- Ultima actualizare: 08-04-2025 01:30:25
Comandă The Ultimate Guide to Candlestick Online, Simplu și Rapid
Prin intermediul platformei YEO, poți comanda The Ultimate Guide to Candlestick de la libris.ro rapid și în siguranță. Bucură-te de o experiență de cumpărături online optimizată și descoperă cele mai bune oferte actualizate constant.
Descriere magazin:
The Ultimate Guide to Candlestick Chart Patterns is your \'candlestick patterns cheat sheet\' for making technical trading decisions. Learn to spot trends and act on them intelligently. This book has everything you need: An introduction to candlestick chart patterns and why they can take your trading to the next level 30+ detailed candlestick patterns with a historical example for every chart Exit and entry suggestions Candlestick chart pattern trading tips Real trading examples from TrendSpider From the book: HOW TO READ CANDLESTICK CHARTS A candlestick is a type of chart used in trading as a visual representation of past and current price action in specified time frames. Depending on the time frame of the chart, each candlestick consists of minutes, a day, a week or a month trading range. On an intraday chart, a candle might represent periods of time like 1-minute, 5-minutes, 15-minutes or one hour. A daily shows candles that represent each day\'s trading range. A weekly chart shows candles that represent each week\'s trading range. A monthly chart shows candles that represent each month\'s trading range. Note that during the day, a daily candle will change as the range changes and price reaches a final, closing price. Similarly, during the week and in the middle of the month, the candles in those time frames are still changing and are not finalized until their time frame closes. At the end of the day, week or month, the candle for that time period is finalized. A candlestick consists of the body with an upper or lower wick or shadow. Most candlestick charts show a higher close than the open as either a green or white candle. The opening price as the bottom of the candle and the closing price as the high of the candle. Also, most candlestick charts show a lower close than the open represented as a red or black candle, with the opening price as the top of the candle body and the closing price as the low of the candle body. ...and much more! By the time you finish this book, I think you\'ll agree that candlesticks are the best type of charts for most traders to use for trading price action patterns.
Produse asemănătoare
The Land of Stories: The Ultimate Book Hugger\'s Guide - Chris Colfer
![]() libris.ro
libris.ro
Actualizat in 28/10/2025
72.49 Lei
Star Wars: The Ultimate Cookbook: The Official Guide to Cooking Your Way Through the Galaxy - Insight Editions
![]() libris.ro
libris.ro
Actualizat in 28/10/2025
223.15 Lei
Grammar Girl Presents the Ultimate Writing Guide for Students - Mignon Fogarty
![]() libris.ro
libris.ro
Actualizat in 28/10/2025
106.02 Lei

The Big Book of Backyard Medicine: The Ultimate Guide to Home-Grown Herbal Remedies - Julie Bruton-seal
![]() libris.ro
libris.ro
Actualizat in 28/10/2025
111.55 Lei


The Gamesmasters Presents: The Ultimate Minecraft Builder\'s Guide - Future Publishing
![]() libris.ro
libris.ro
Actualizat in 28/10/2025
55.75 Lei
Produse marca Atanas Matov

The Ultimate Guide to Candlestick Chart Patterns - Atanas Matov
![]() libris.ro
libris.ro
Actualizat in 08/04/2025
111.53 Lei